How we came up with a decent product idea
Discover how the idea for ChartDB was born out of real-world frustrations and how Jonathan and Guy, longtime colleagues, teamed up to build an open-source database visualization tool. Learn about their journey from identifying a problem to launching a functional MVP in just a few weeks, and how ChartDB has evolved into a valuable resource for developers and data analysts worldwide.
Coming up with a new product idea can seem like a daunting task, but sometimes the best ideas come from solving your own frustrations. ChartDB was exactly that-a solution to a pain point I kept running into as a software engineer.
Identifying the Problem
For years, I had been working with various databases, constantly needing to visualize and understand their schemas. The tools I tried were either too cumbersome, expensive, or simply didn’t fit into the fast-paced, modern workflows of developers. I found myself spending way too much time trying to configure tools or piecing together database structures manually.
That’s when I had a realization: What if we could build something simple, intuitive, and open-source? Something that empowers developers to visualize their database schemas quickly without hassle.
Teaming Up with Guy
Enter Guy, my longtime colleague and friend. Guy is an expert in frontend development and UX design, and like me, he was no stranger to the frustrations of using clunky database tools.
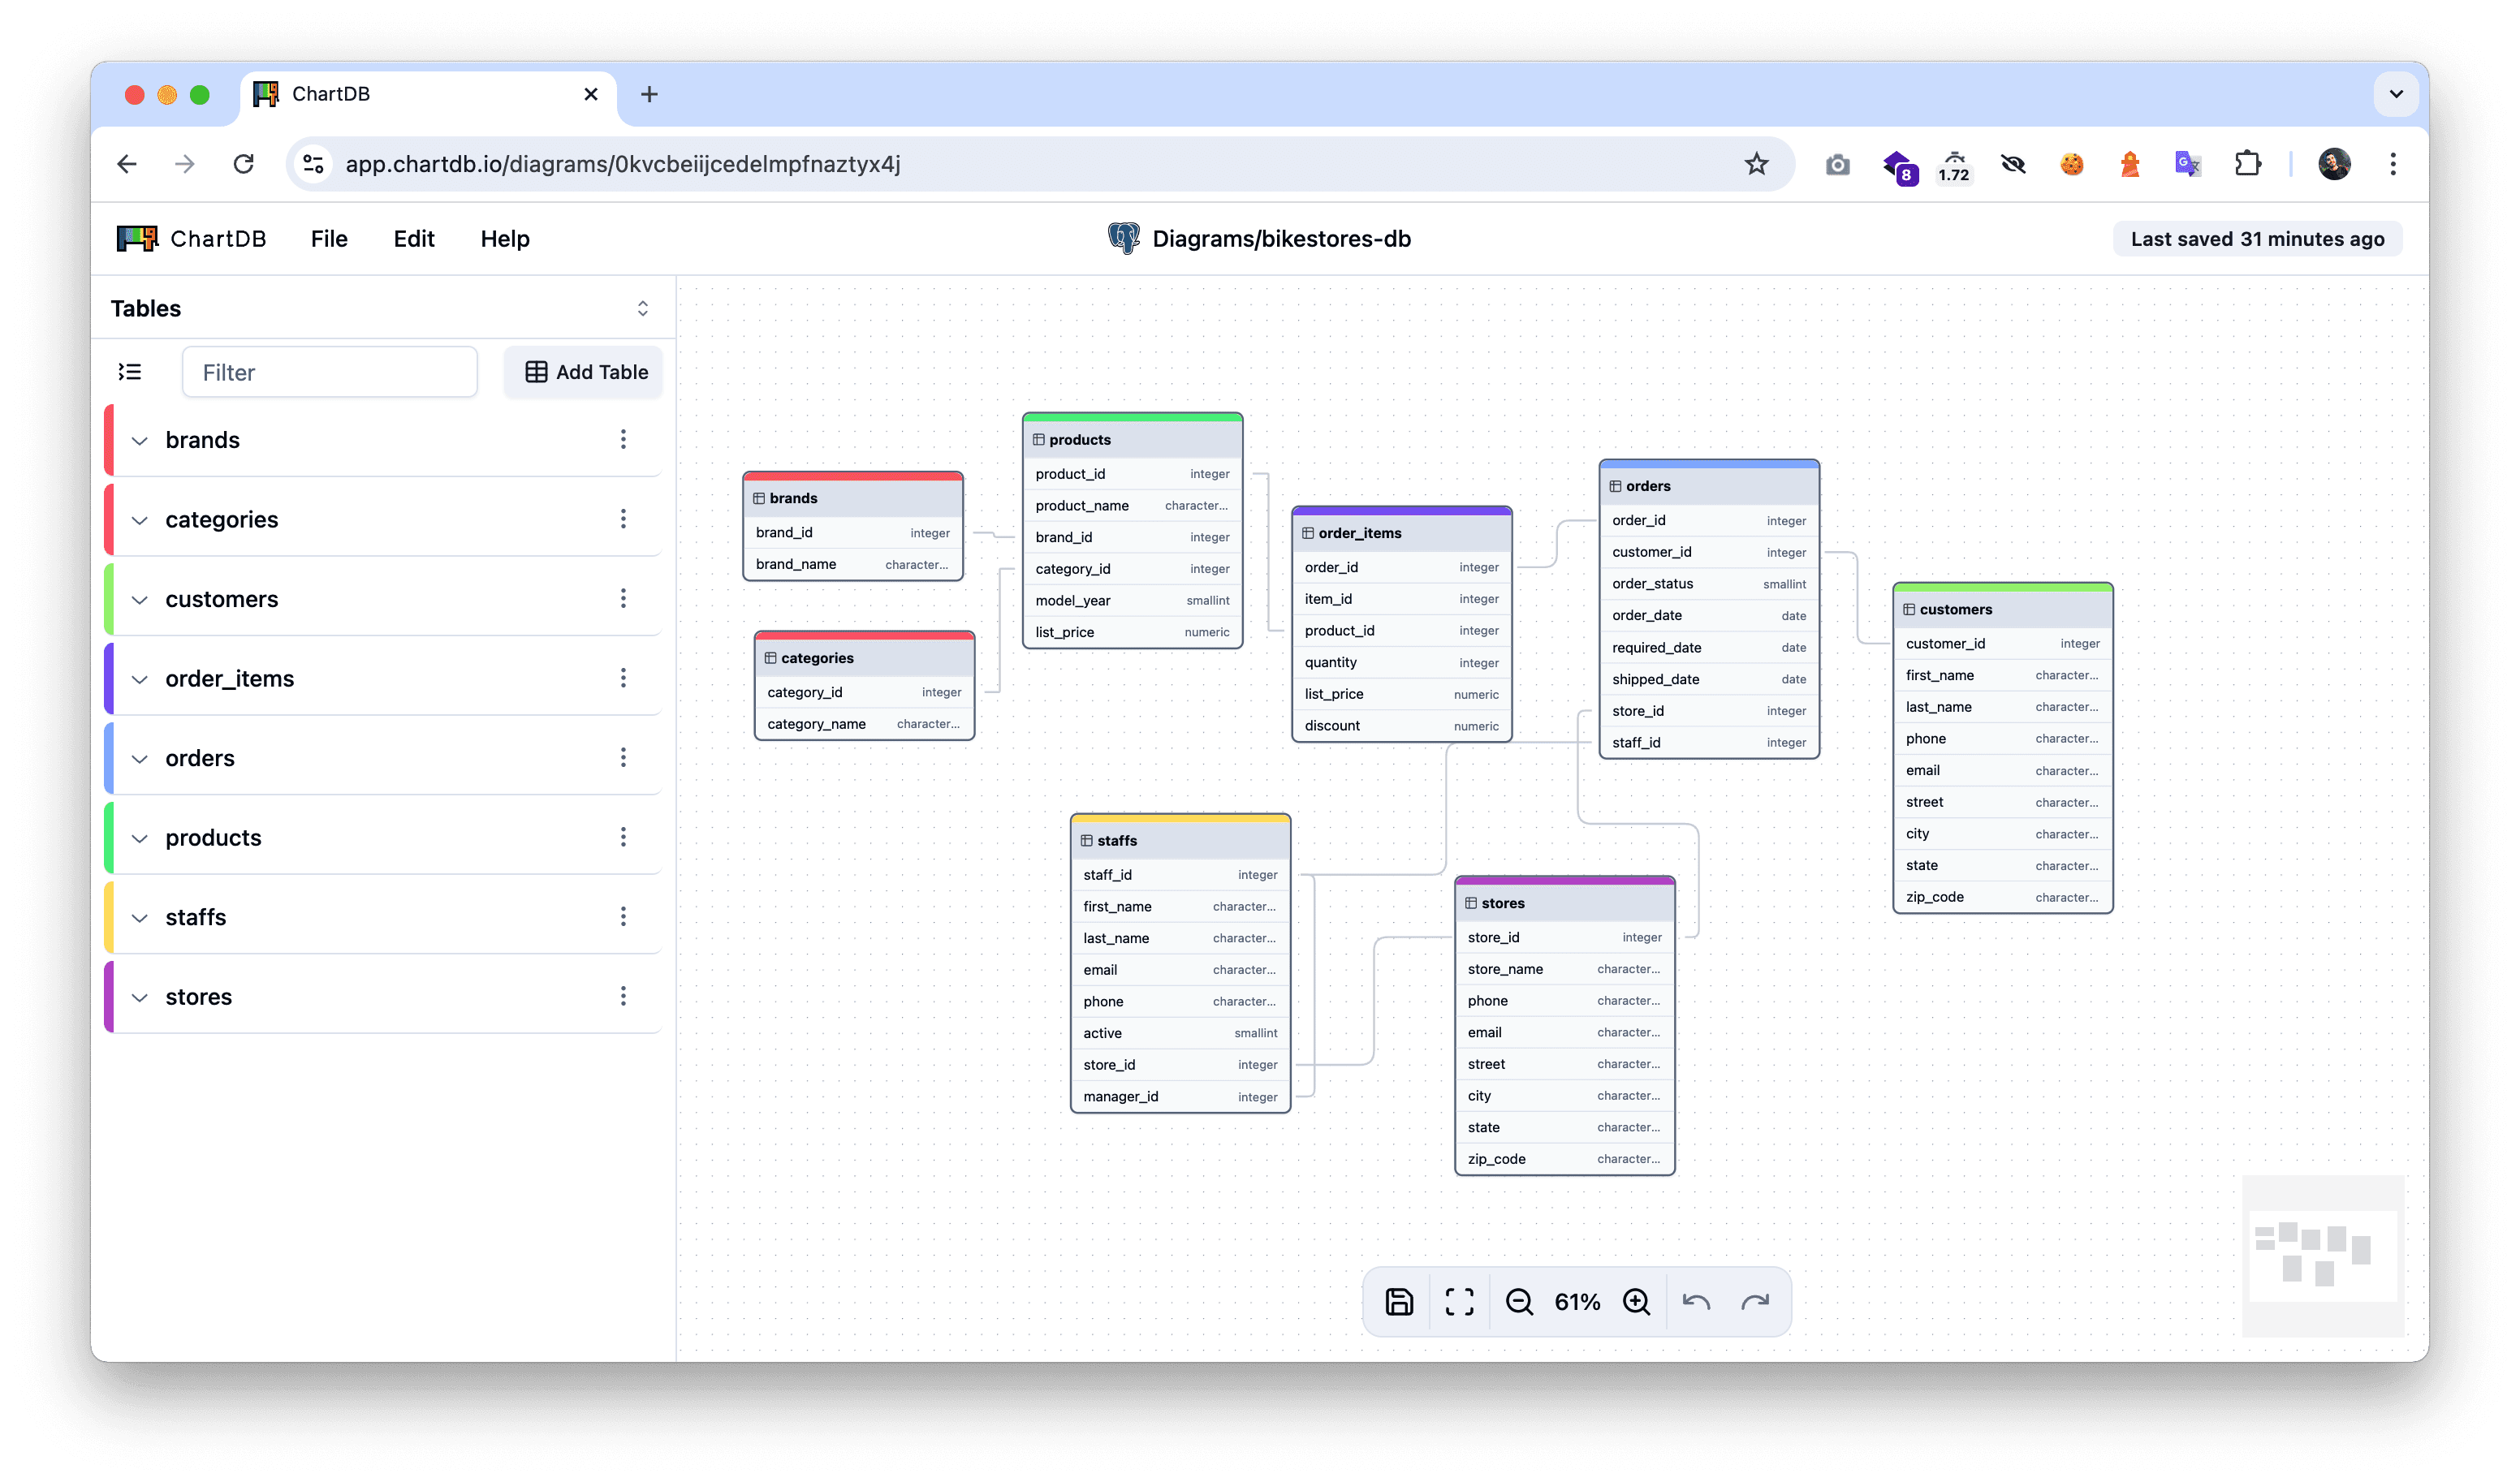
When I shared my idea for a lightweight, easy-to-use database visualization tool, Guy was instantly on board. Together, we started brainstorming how we could turn this idea into something real. The goal was clear: to build an open-source tool where developers and analysts could generate database diagrams with a single query.

Building the First Version 🚀
We knew we needed to focus on one key feature for the MVP: Instant Schema Import. We kept the scope lean and set a goal to build a version that could solve the problem right away. Guy took charge of the frontend, designing a modern, intuitive interface, while I worked on the backend, ensuring the tool could handle different databases smoothly.
The collaboration was seamless. In just a few weeks, we had a functional MVP that did exactly what we wanted-visualize database schemas quickly and efficiently. It wasn’t perfect, but it solved the core problem we set out to address.
The Evolution of ChartDB
Since that first version, ChartDB has grown beyond what we initially imagined. The community feedback has been incredible, and we’ve continuously iterated based on user input. What started as a simple idea to fix a common problem has turned into a powerful tool for developers and analysts worldwide.


